


Introduction
Agritourism services along with direct-to-consumer sales have grown significantly in the United States in recent years, reflecting both increased interest from consumers in knowing where their food comes from and a growing desire to shorten supply chains in the context of the local food movement (Low and Vogel Reference Low and Vogel2011; Brune et al. Reference Brune, Knollenberg, Stevenson, Barbieri and Schroeder-Moreno2021). For farmers, these two supplemental income sources may contribute to farm profitability and, as such, increase farm survival odds. Despite the rapidly expanding literature on agritourism, direct sales, and the “local food” movement more generally, important questions remain about these activities, especially about their simultaneous adoption in the same community as well as their individual and joint impacts on farm and community economic well-being.
The contributions of this paper are as follows. In addition to providing updated basic descriptive information about agritourism and direct sales to consumers, we apply spatial statistical methods to understand how these activities are clustered over space and examine whether the two activities detract from or reinforce one another both within counties and across county lines, using panel data analysis. We thus add to Van Sandt’s et al. (Reference Van Sandt, Low and Thilmany2018) study of placed-based factors an analysis of the interdependence of agritourism with direct sales operations within and across counties. To preview the main findings, agritourism and direct sales reinforce one another within the same county: counties with higher shares of farms with direct sales five years earlier tend to have higher shares of farms with agritourism, and vice versa. These mutual impacts are statistically significant within counties but not consistently across neighboring counties. Our findings may help local agriculture officials as well as economic developers in terms of local strategic planning for farm resilience and growth either within counties or across county borders in a regional, multi-county context.
The plan of this paper is as follows. After reviewing the literature to document research gaps and to motivate our choice of regressors, we present a conceptual model of county-based agritourism and direct-to-consumer sales activities, along with the spatial statistical tools used, and discuss why these tools are appropriate. This is followed by a discussion of the public secondary data available from the Census along with data limitations; we then present descriptive statistical and tabular results, followed by the main analytical results. The concluding section provides policy recommendations as well as suggestions for future research.
Literature review
Research on agritourism services in the United States has expanded dramatically over the last decade, often in the context of the local foods movement, which includes direct sales from farmers to consumers.Footnote 1 While most of the older literature focuses on the impacts of these services, more recent studies examine barriers to entry for farmers. Topics covered range from community development impacts of agritourism and local foods (Brown et al. Reference Brown, Goetz, Ahearn and Liang2014; Naidoo and Sharpley Reference Naidoo and Sharpley2016; Benedek et al. Reference Benedek, Fertő and Szente2020; Stickel and Deller Reference Stickel and Deller2020) to their potential to make rural communities more sustainable (Ammirato et al. Reference Ammirato, Felicetti, Raso, Pansera and Violi2020; Ciolac et al. Reference Ciolac, Iancu, Brad, Popescu, Marin and Adamov2020), factors that attract visitors to agritourism destinations (Pesonen et al. Reference Pesonen, Komppula, Kronenberg and Peters2011), their relevance for food systems (Brune, et al. Reference Brune, Knollenberg, Stevenson, Barbieri and Schroeder-Moreno2021); the social capital of agritourism entrepreneurs (Khazami, et al. Reference Khazami, Nefzi and Jaouadi2020) and the human capital of local foods purveyors (Jablonski, Bauman and Thilmany Reference Jablonski, Bauman and Thilmany2021); as well as factors restricting farmers’ ability to offer agritourism services, such as zoning and permitting rules (Wang et al. Reference Wang, Hollas, Chase, Conner and Kolodinsky2022) and the availability of support structures (Schmidt et al. Reference Schmidt, Chase, Barbieri, Rilla, Knights, Thilmany and Leff2022).
Studies suggest that farmers successfully use agritourism as a diversification strategy (Barbieri Reference Barbieri2013; Khanal and Mishra Reference Khanal and Mishra2014; Hochuli Reference Hochuli, Hochuli and Schmid2021), enhancing farm businesses’ perceived profitability (Hollas, et al. Reference Hollas, Chase, Conner, Dickes, Lamie, Schmidt and Quella2021). Agritourism has also been shown to provide opportunities for rural entrepreneurs (McGehee and Kim Reference McGehee and Kim2004; Dickes, et al. Reference Dickes, Arogundade and Lamie2020) and to support rural community economic viability more broadly, although the evidence here is mixed (e.g., Brown et al. Reference Brown, Goetz, Ahearn and Liang2014; Stickel and Deller Reference Stickel and Deller2020).
Studies suggest that agritourism consumers strongly prefer local foods, and while their impact on local food systems has been questioned (Haven-Tang, et al. Reference Haven-Tang, Thomas and Fisher2022), the agritourism experience has also been found to impact food purchasing habits after visitors return home (see Brune, et al. Reference Brune, Knollenberg, Stevenson, Barbieri and Schroeder-Moreno2021). Through agritourism, farmers market not only their products but a certain “way of life” (Tew and Barbieri Reference Tew and Barbieri2012) that is embedded in the rural place; as a result, tourists as travelers embrace intra- and inter-regional identities that make such experiences unique.
Existing studies have also examined “place-based” and spatial considerations, which are integral to agritourism, and this study. The proximity of activities to natural amenities (Gartner Reference Gartner2005; Hill et al. Reference Hill, Loomis, Thilmany and Sullins2014) and urban areas (Che Reference Che2007), for example, and the geographic region itself (Bagi and Reeder Reference Bagi and Reeder2012) all affect the presence and viability of agritourism enterprises (Van Sandt et al. Reference Van Sandt, Low and Thilmany2018, Reference Van Sandt, Low, Jablonski and Weiler2019). Critical to our own work, drivers of agritourism clusters (not including direct sales) have been explored by Van Sandt et al. (Reference Van Sandt, Low and Thilmany2018) using 2012 census data. Their seminal paper was the first to use regional science methods to examine how agritourism development depends on place-based factors, using spatial statistical analysis to determine the location of agritourism clusters at the United States county level. They found that “travel infrastructure, region and rurality, characteristics of the local economy, and proximity to outdoor attractions are all significantly associated with the probability of a county being an agritourism hot spot.” (Van Sandt et al. Reference Van Sandt, Low and Thilmany2018, p. 592).
Khanal et al. (Reference Khanal, Honey and Omobitan2020) subsequently used spatial regression models, zip-code, and county-level data to investigate locational determinants of agritourism operations, finding that higher median household income, more education, and wood product manufacturing positively impacted the establishment of agritourism farms. Agritourism clusters continue to be explored by researchers (see Joshi et al. Reference Joshi, Sharma and Singh2020; Roman, et al. Reference Roman, Roman and Prus2020; Rauniyar, et al. Reference Rauniyar, Awasthi, Kapoor and Mishra2021 among others). However, prior studies for the most part do not consider direct sales to tourists when analyzing agritourism clusters.
Chase et al. (Reference Chase, Stewart, Schilling, Smith and Walk2018) view direct sales as an integral part of the agritourism experience: food products, and other direct purchases made on the farm, are essentially souvenirs from the agritourism experience. Acquisition of souvenirs has been identified as a primary motivation for travelers (Timothy Reference Timothy2005) and demand for locale-specific agricultural products through direct sales in agritourism demonstrates consumer desires for short food supply chains (Nemes, et al. Reference Nemes, Csizmadiáné Czuppon, Kujáni, Orbán, Szegediné Fritz and Lajos2019; Domi and Belletti Reference Domi and Belletti2022). Additionally, direct sales revenue has been shown to be crucial to the viability of agritourism enterprises (Barbieri and Tew Reference Barbieri and Tew2010). Only Brown et al. (Reference Brown, Goetz, Ahearn and Liang2014) include both agritourism and local foods revenues at the county level within the same regression analysis, and, more importantly, no prior research has considered direct sales within agritourism cluster analysis in the United States. To fill this void in the literature, we test two hypotheses: (1) the share of agritourism in a county affects the share of direct-to-consumer sales in this county and vice versa and (2) measurable interactions exist across county lines between agritourism and direct sales. We, therefore, add to Van Sandt’s et al. (Reference Van Sandt, Low and Thilmany2018) study of placed-based factors an analysis of the interdependence of agritourism with direct sales activities.
Conceptual model and statistical methods
We begin with a conceptual model in which agritourism (AgTour t) and direct sales (DiSale t) income at time t depend on four sets of broad determinants: (a) farm characteristics such as the value of farmland and the size distribution of farms; (b) farmer or operators’ own characteristics, such as age and gender; (c) the type of farming practiced, including small animals or vegetable production; and (d) the socioeconomic conditions of the local county, including population size, social capital, political leanings of voters, and the poverty rate as well as average wages as a measure of the opportunity cost of engaging in agritourism or direct sales. As noted earlier, these variables are drawn primarily from the existing literature, especially Van Sandt et al. (Reference Van Sandt, Low and Thilmany2018) and Schmidt et al. (Reference Schmidt, Goetz and Tian2021).
As an additional consideration, both building on the finding of Van Sandt et al. (Reference Van Sandt, Low and Thilmany2018) regarding strong spatial patterns and to address our central question of whether the AgTour and DiSale variables reinforce or detract from one another either within counties or across county borders, we set up the regression as a Seeming-Unrelated-Regression (SUR) model combined with a spatial lag structure for the dependent variables; in particular, we specify a Spatial Durban Model (SDM) based on López, Mínguez and Mur (Reference López, Mínguez and Mur2020), as follows:
 $$AgTou{r_t} = {\rho _1}{\bi W}AgTou{r_t} + {\alpha _{10}} + {\alpha _{11}}AgTou{r_{t - 1}} + {\alpha _{12}}DiSal{e_{t - 1}} + {{\bi X}_{{\rm{\;}}t - 1}}{{\bi\beta}_1} + {\bi W}\left( {{\theta _{11}}AgTou{r_{t - 1}} + {\theta _{12}}DiSal{e_{t - 1}} + {{\bi X}_{t - 1}}{\gamma _1}} \right) + {\mu _1} + {\delta _{11}}Year2012 + {\delta _{12}}Year2017 + {e_{1t}}$$
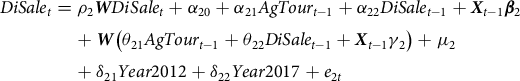 $$DiSal{e_t} = {\rho _2}{\bi W}DiSal{e_t} + {\alpha _{20}} + {\alpha _{21}}AgTou{r_{t - 1}} + {\alpha _{22}}DiSal{e_{t - 1}} + {{\bi X}_{t - 1}}{{\bi\beta} _2} + {\bi W}\left( {{\theta _{21}}AgTou{r_{t - 1}} + {\theta _{22}}DiSal{e_{t - 1}} + {{\bi X}_{t - 1}}{\gamma _2}} \right) + {\mu _2} + {\delta _{21}}Year2012 + {\delta _{22}}Year2017 + {e_{2t}}$$
Dependent variables AgTour t and DiSale t are two
 $n \times 1$
vectors of n counties at time t, for agritourism and direct sales.
W
is an
$n \times 1$
vectors of n counties at time t, for agritourism and direct sales.
W
is an
 $n \times n$
spatial weights matrix based on the queen-typed contiguity with sharing either borders or vertices. The association of agritourism and direct sales is modeled with the terms DiSale t−1, W DiSale t−1 in equation (1) for agritourism and AgTour t−1, W AgTour t−1 in equation (2) for direct sales. For the residuals in the two equations, e 1t and e 2t, we assume
$n \times n$
spatial weights matrix based on the queen-typed contiguity with sharing either borders or vertices. The association of agritourism and direct sales is modeled with the terms DiSale t−1, W DiSale t−1 in equation (1) for agritourism and AgTour t−1, W AgTour t−1 in equation (2) for direct sales. For the residuals in the two equations, e 1t and e 2t, we assume
 $E\left( {{e_{1,it}}} \right) = E\left( {{e_{2,it}}} \right) = 0$
,
$E\left( {{e_{1,it}}} \right) = E\left( {{e_{2,it}}} \right) = 0$
,
 $Var\left( {{e_{1,it}}} \right) = \sigma _1^2,\;Var\left( {{e_{2,it}}} \right) = \sigma _2^2$
, and
$Var\left( {{e_{1,it}}} \right) = \sigma _1^2,\;Var\left( {{e_{2,it}}} \right) = \sigma _2^2$
, and
 $Cov\left( {{e_{1,it}},{e_{2,it}}} \right) = {\sigma _{12}},\;i = 1, \ldots n$
. The correlation among residuals in the SUR model captures any association that is unaccounted for between agritourism and direct sales.
$Cov\left( {{e_{1,it}},{e_{2,it}}} \right) = {\sigma _{12}},\;i = 1, \ldots n$
. The correlation among residuals in the SUR model captures any association that is unaccounted for between agritourism and direct sales.
Other terms in the SUR-SDM model include the spatial autoregressive terms,
 ${\rho _1}{\bi W}AgTou{r_t}$
and
${\rho _1}{\bi W}AgTou{r_t}$
and
 ${\rho _2}{\bi W}DiSal{e_t}$
, determinants drawn from our literature review for agritourism and direct sales described earlier,
${\rho _2}{\bi W}DiSal{e_t}$
, determinants drawn from our literature review for agritourism and direct sales described earlier,
 ${{\bi X}_{t - 1}}$
, and its neighboring values,
${{\bi X}_{t - 1}}$
, and its neighboring values,
 ${{\bi WX}_{t - 1}}$
, county fixed effects,
${{\bi WX}_{t - 1}}$
, county fixed effects,
 ${\mu _1}$
and
${\mu _1}$
and
 ${\mu _2}$
, and time fixed effects, Year 2012 and Year 2017. County fixed effects account for the influence of time-invariant factors, such as natural conditions and distance to big cities, as well as rules and regulations that circumscribe farmers’ ability to offer agritourism or direct sales; this is a critical advantage of using panel data, as a consistent database on these rules does not exist (unlike distance measures, which are easier to implement; of course, this also assumes that the rules do not change over time). All the right-hand side variables except for the spatial autoregressive terms in the model are lagged by five years (the intercensal years of the Census of Agriculture) to alleviate endogeneity concerns.
${\mu _2}$
, and time fixed effects, Year 2012 and Year 2017. County fixed effects account for the influence of time-invariant factors, such as natural conditions and distance to big cities, as well as rules and regulations that circumscribe farmers’ ability to offer agritourism or direct sales; this is a critical advantage of using panel data, as a consistent database on these rules does not exist (unlike distance measures, which are easier to implement; of course, this also assumes that the rules do not change over time). All the right-hand side variables except for the spatial autoregressive terms in the model are lagged by five years (the intercensal years of the Census of Agriculture) to alleviate endogeneity concerns.
Because of our interest in spatial patterns, we next present the local Moran’s I statistic and use this in diagnostic descriptive analyses to confirm the relevance of our SUR-SDM approach, in addition to describing spatial patterns that are valuable in their own right. In other words, we use the local Moran’s I in an exploratory analysis to identify hotspots of agritourism and direct sales to consumers. Next, we use the bivariate local Moran’s I to detect any spatial association of agritourism and direct sales. Following Anselin (Reference Anselin2020), the local Moran’s I for variable x, which has a mean of zero and a standard deviation of one, in county i can be expressed as:
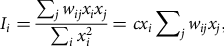 $${I_i} = {{\sum\nolimits_j {{w_{ij}}} {x_i}{x_j}} \over {\sum\nolimits_i {x_i^2} }} = c{x_i}\sum\nolimits_j {{w_{ij}}} {x_j},$$
where
 $c = 1/\mathop \sum \nolimits_i x_i^2$
.
$c = 1/\mathop \sum \nolimits_i x_i^2$
.
Here, w ij is the (i, j) element in a queen-type contiguity spatial weight matrix for all counties in the 48 continental states. We use permutation tests (999 permutations) to compute the p-value of the significance of a local Moran’s I in a county and then identify High-High, High-Low, Low-High, and Low-Low clusters based on the classification process in Anselin (Reference Anselin2020). A High-High cluster means that x in county i and the spatially weighted average of x in neighboring counties are higher than the overall average and such a gap is significant at the 95% level. To assess the spatial association of two variables, agritourism (x) and direct sales (y), both of which are standard normalized, we compute the bivariate local Moran’s I as follows:
 $$I_i^B = c{x_i}\mathop \sum \nolimits_j {w_{ij}}{y_j},$$
where w ij and c are similarly defined as in equation (1). We again use permutation tests to identify clusters of agritourism and direct sales, whereby a High-High cluster indicates that x i in county i and the average of y in neighboring counties are higher than the overall average and significant at the 95% level. The bivariate local Moran’s I does not control for the correlation between the two variables at each location (i.e., the correlation between x i and y i) (Anselin Reference Anselin2020, Chapter 3), and so we measure this with the partial correlation coefficients in the linear regression model.
To summarize, we choose the SUR-SDM model for three reasons. First, the exploratory analysis with local Moran’s I suggests a strong spatial autocorrelation of agritourism and direct sales, necessitating the inclusion of spatial autoregressive terms. Second, we hypothesize that the determinant factors from one county’s neighboring counties, such as population density and personal income, also influence local agritourism and direct sales in that county, that is, spatial spillover effects, which are accounted for with the Durbin terms,
 ${{\bi WX}_{t - 1}}$
.
${{\bi WX}_{t - 1}}$
.
Third, using the LM tests for model selection proposed by López, Mur and Angulo (Reference López, Mur and Angulo2014), we find that a spatial lag model with spatially autoregressive errors (SARAR) has the highest LM statistic (1341.01) followed by a spatial error model (SEM) (1334.96), with only a 0.45% difference. (See Table S2 for all LM statistics.) However, the LM test cannot compare an SDM directly with SARAR or SEM models. LeSage and Pace (Reference LeSage and Pace2009) show that an SDM model embeds an SEM model, and given the fact that SARAR models cannot accommodate spatial lags of regressors to account for spatial spillover effects of neighboring counties’ characteristics, we suggest that an SDM is the most appropriate model for this study. Tests for model selection are shown in Tables S2–S4 in the supplemental materials.
Data and caveats
In this section, we describe the data sources, along with caveats related to how the data are defined and collected, and present summary statistics to provide additional descriptive context for the regression analysis. As noted, we use panel data from 2007, 2012, to 2017, the most recent year available, which present an improvement over prior studies. The quinquennial Census of Agriculture, conducted by the National Agricultural Statistics Service of U.S. Department of Agriculture (USDA NASS), asks about direct-to-consumer sales, which consist of “edible agricultural products for human consumption,” and asks separate questions about agritourism income exclusive of direct sales. Agritourism activities are only captured in a limited manner.Footnote 2 While the Census of Agriculture reports direct-to-consumer sales and agritourism as separate activities, considering both together more accurately reflects consumers’ views and their experiences, as noted in Nemes et al. (Reference Nemes, Csizmadiáné Czuppon, Kujáni, Orbán, Szegediné Fritz and Lajos2019), Chase et al. (Reference Chase, Stewart, Schilling, Smith and Walk2018) and Sgroi et al. (Reference Sgroi, Di Trapani, Testa and Tudisca2014). In addition, popular agritourism-type activities, such as the experience of cutting Christmas trees, are not considered in either category.
Despite these limitations, the USDA NASS Census of Agriculture is currently the best and most comprehensive source of national-level secondary data from the producer side and is widely used by researchers. The data show that U.S. agritourism sales nearly doubled from 2007 to 2017, from $567 to $949 million in nominal dollars. Only 28,575 farms reported such activity in 2017, and although this was a 22% increase from 2007, they represent less than 1.5% of all farms. While the number of farms engaged in direct sales fell (to 144,530 in 2012 and 130,056 in 2017, a 10% decrease), the total value of direct sales rose from $1,309.8 million in 2012 to $2,805.3 million in 2017 in nominal dollars, a 114% increase, which is due in part to a change in the survey question to include value-added productsFootnote 3 (U.S. Department of Agriculture/National Agricultural Statistics Service 2019).
Table 1 shows the type of farms that offer agritourism and direct-to-consumer sales and their geographical distributionFootnote 4 across the United States and four census regions. The Northeast has the highest share of farms engaging in agritourism or direct sales, with 18.8% of all farms, followed by the Western region with 10.8%, and the Midwest region has the least. As expected, the number of farms with direct sales but no agritourism activity is far greater than that of farms with agritourism but no direct sales and the number having both businesses. The Northeast also has the highest share of farms that offer agritourism (6.3%).
Table 1. Farms with agritourism and/or direct sales: United States and regions
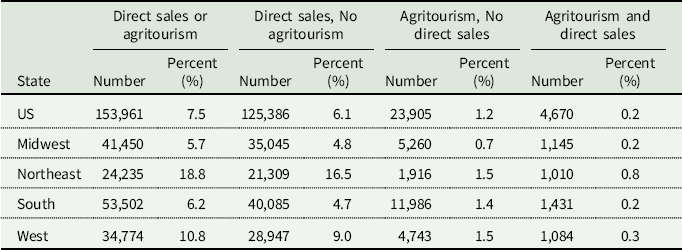
Notes: Percentages are computed with respect to the total number of farms, including farms without agritourism or direct sales, in each row. The same for all tables that follows. The regions are Census Regions whose definition can be found in https://www2.census.gov/geo/pdfs/maps-data/maps/reference/us_regdiv.pdf.
Texas, California, and Pennsylvania are the top three states with producers with direct sales or agritourism income (Table 2). However, the share of farms with direct sales or agritourism is much higher in New York (18.6%) and Oregon (16.3%).
Table 2. Farms with agritourism and/or direct sales: United States and top 10 states, ranked by the percentage of farms with direct sales or agritourism
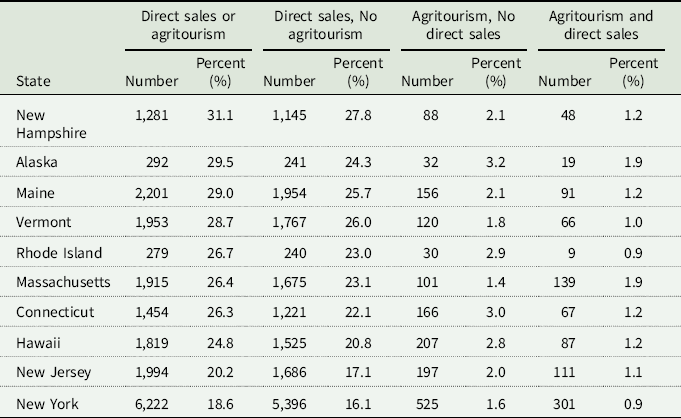
Source: USDA, NASS special data request and authors’ calculation.
Table 3 lists the type of farming for each direct sales category and agritourism. Notably, 42% of all vegetable and melon-producing farms are involved in direct sales. This is also the largest agritourism and direct sales category (2.23%). Among the farms that received agritourism and direct sales income, beef, cattle, and ranching farms are the largest category (23%), followed by fruit and tree nut farming (13.5%) and vegetable and melon farming (13.4%). The latter two categories point to the diversified nature of agritourism farms. In general, agritourism visitors are drawn to farms that offer various agricultural products and unique experiences that lend themselves to human interactions, such as horses, petting areas, and pick-your-own fruit and vegetable farms (Van Sandt et al. Reference Van Sandt, Low and Thilmany2018). The state with the most farms claiming agritourism income is Texas, where 60% of these farms are cattle farms and ranches, probably offering hunting. However, this is only based on anecdotal data as the Census does not collect information on what type of activities agritourism farms received their income from.
Table 3. Farms with agritourism and/or direct sales by NAICS: United States
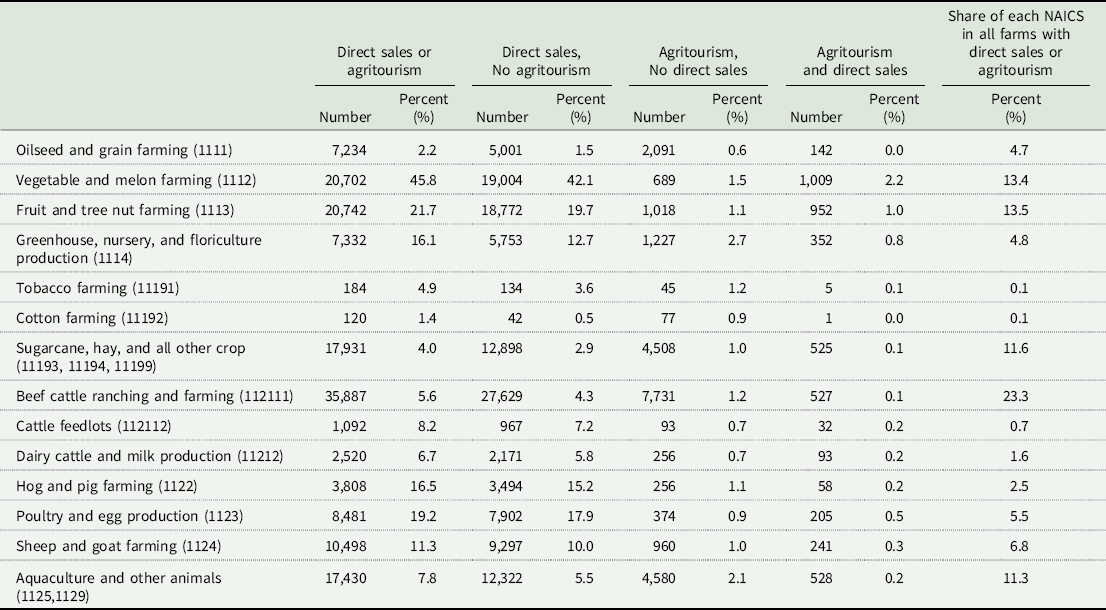
Notes: Except for the last column, the percentages are computed with respect to the total number of farms in each NAICS. The percentage in the last column are computed by the first column divided by the sum of this column. Source: USDA NASS, special data request.
Exploratory spatial analysis results
Figure 1 shows the maps of clusters of agritourism in 2012 and 2017, based on their local Moran’s I, respectively. The two largest High-High clusters (in red) stretch across the Midwest region, from Montana to Texas, and another relatively large one appears in the Northeast region close to New York City. A similar 2012 map is published in Van Sandt et al. (Reference Van Sandt, Low and Thilmany2018). They found that the probability of a county being a hot spot is influenced by outdoor attractions, travel infrastructure, and rurality. In comparison, the 2017 map shows some expansion of the High-High clusters near New York City, Wyoming, and Colorado.

Figure 1. Local Moran’s I for Agritourism.
There is a strong regional variation in direct-to-consumer sales in the United States, mainly caused by the type of agricultural production in the region (fruits and vegetables) and history of outlet development for farmer to growers and farm-to-school channels and farmers’ markets. The highest direct-to-consumer sales are found on the West Coast and Northeast (Low and Vogel Reference Low and Vogel2011). Previous research found a “neighborhood effect” with direct-to-consumer sales, meaning that farms with such sales are surrounded by similar farms (Low and Vogel Reference Low and Vogel2011). This is also evident in the hot and cold spots for this category.
As mentioned above, direct-to-consumer sales census data are not comparable between 2012 and 2017. The Moran’s I is therefore presented separately. Figure 2 shows hot and cold spots for direct sales for 2017. As expected, the hot spots are clustered in the Northeast region, coastal areas in the West, and counties around the Great Lakes.
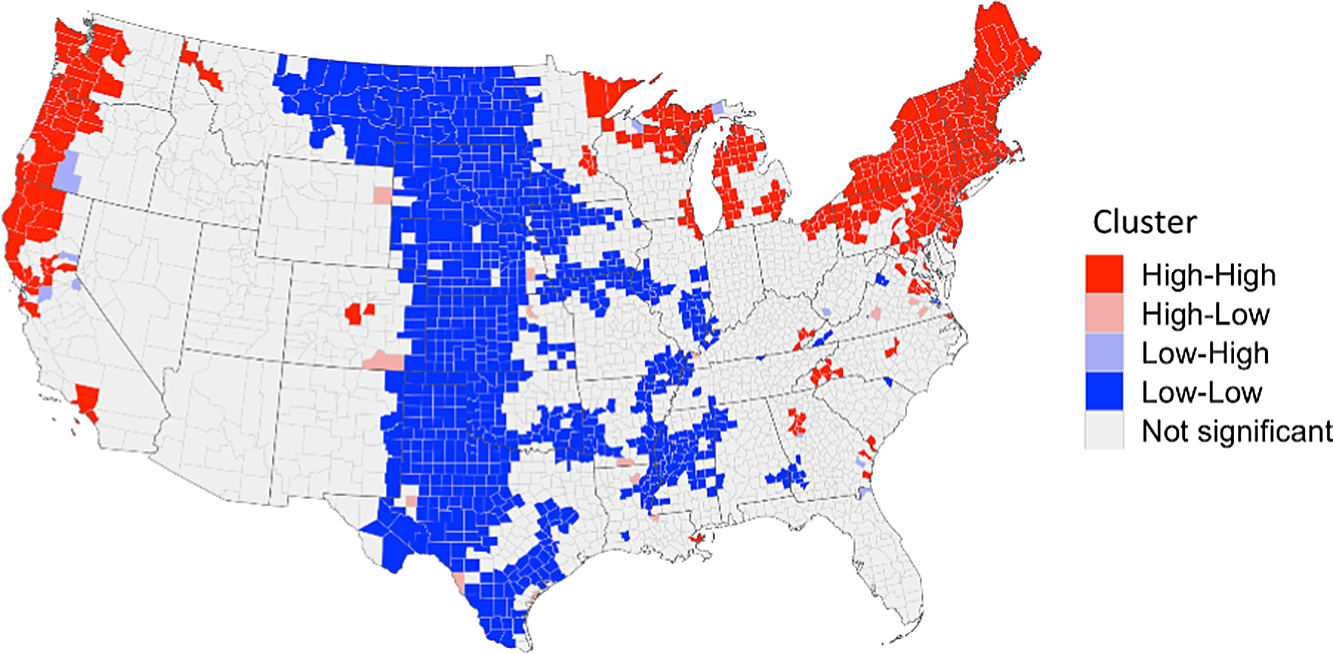
Figure 2. Local Moran’s I for Direct-to-Consumer Sales 2017.
The local Moran’s I for direct-to-consumer sales in 2012 is shown in Figure 3. Even though sales were higher in 2017 compared to 2012, because of the addition of the value-added category in 2017, clusters on the West Coast appear to wane, while those in the Northeast and Great Lakes regions remain relatively intact.

Figure 3. Local Moran’s I for Direct-to-Consumer Sales 2012.
Figure 4 shows agritourism and direct sales clusters based on the bivariate local Moran’s I, using 2017 Census of Agriculture data. When we consider agritourism as x, that is, local county of interest and direct sales as y, that is, neighboring counties (first map), the location of the High-High clusters is determined mainly by the hot spots of direct sales as indicated in Figure 1. The bivariate High-High clusters are still concentrated in the Northeast region, some west coastal counties, and some counties around the Great Lakes, although the number of counties in these clusters is much smaller than in that of direct-sales-alone clusters. Other counties in these regions that are within the direct-sale-alone clusters are classified into the Low-High clusters, where local agritourism businesses are not significant, but direct sales in neighboring counties are. On the contrary, the High-Low clusters are determined mainly by the agritourism-alone High-High clusters, as indicated in Figure 1. When switching (flipping) the roles of agritourism and direct sales as local and neighboring variables, we observe far fewer counties identified as the High-High clusters, as shown in the second row in Figure 4, than in the first row. The greater influence of direct sales compared to agritourism in determining the High-High clusters echoes the fact that there are many more farms with direct sales than with agritourism, as shown in Tables 1–3. Since the local bivariate Moran’s I cannot assess the correlation of agritourism and direct sales in the same county, we compute the simple correlation coefficients between agritourism and direct sales, which is 16.7% and statistically significant at the 1% level.
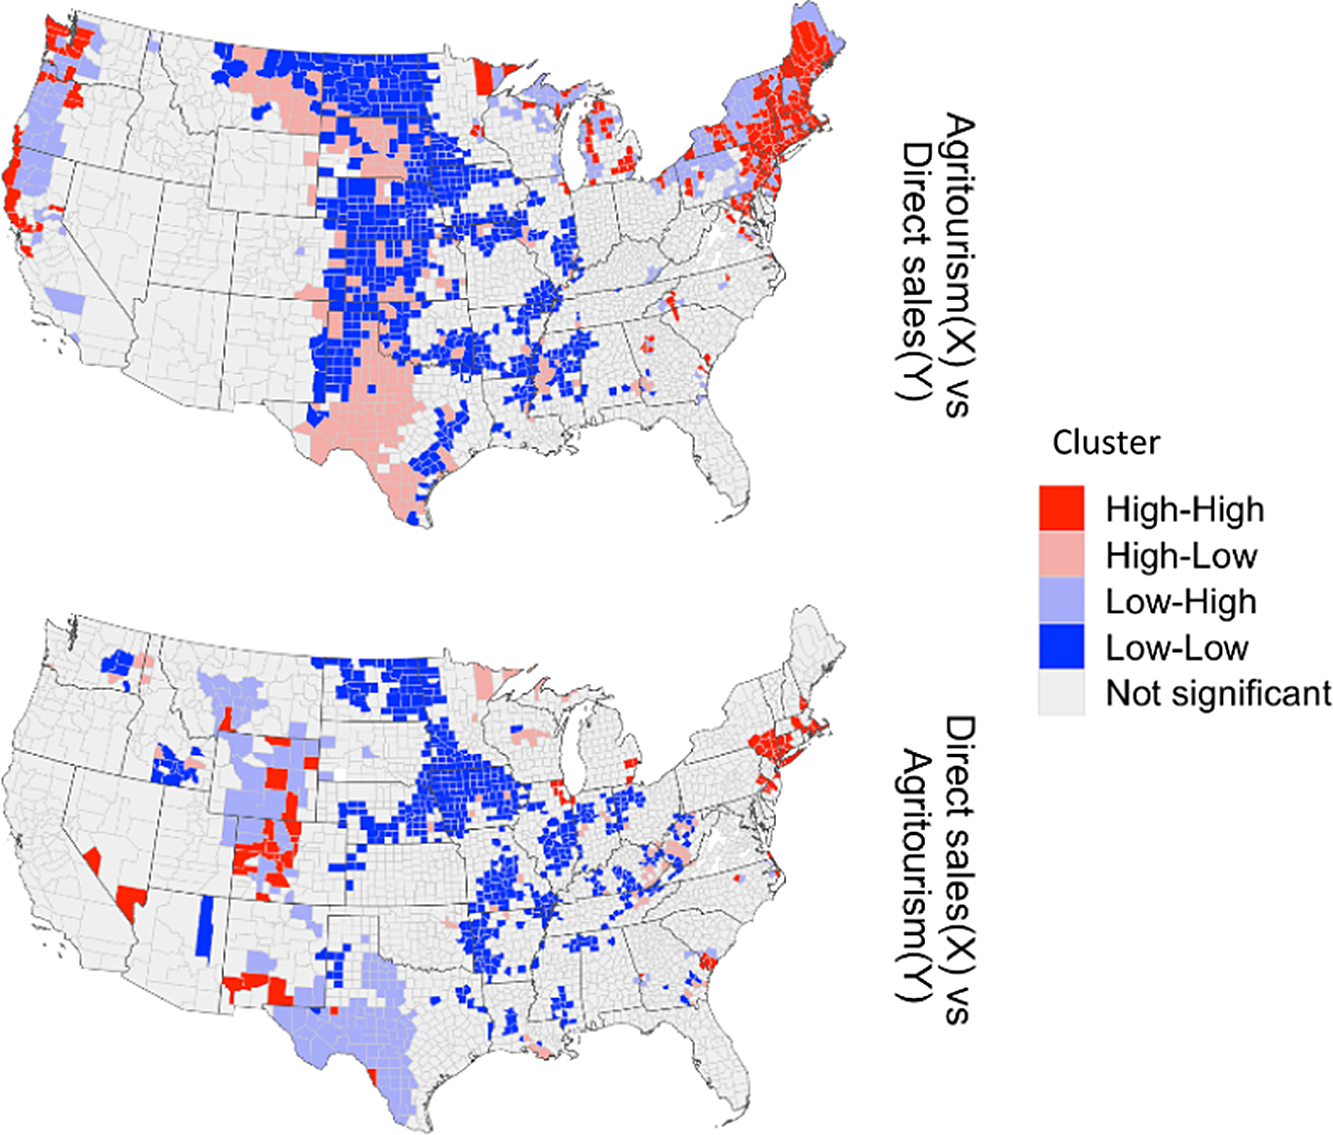
Figure 4. Bivariate Moran’s I (2017).
The first map shows agritourism as the local county of interest and direct sales as the neighboring counties (first map); the second map shows agritourism as the neighboring variable and direct sales as the local variable.
The exploratory analyses with univariate and bivariate local Moran’s I reveal that many counties are in either the High-High or Low-Low clusters, implying to some degree a positive association of the two activities. However, we also observe many counties in the Low-High or High-Low clusters, where we cannot tell whether the set two activities are positively associated. Further confirmation thus requires regression analysis.
Variable selection and data sources
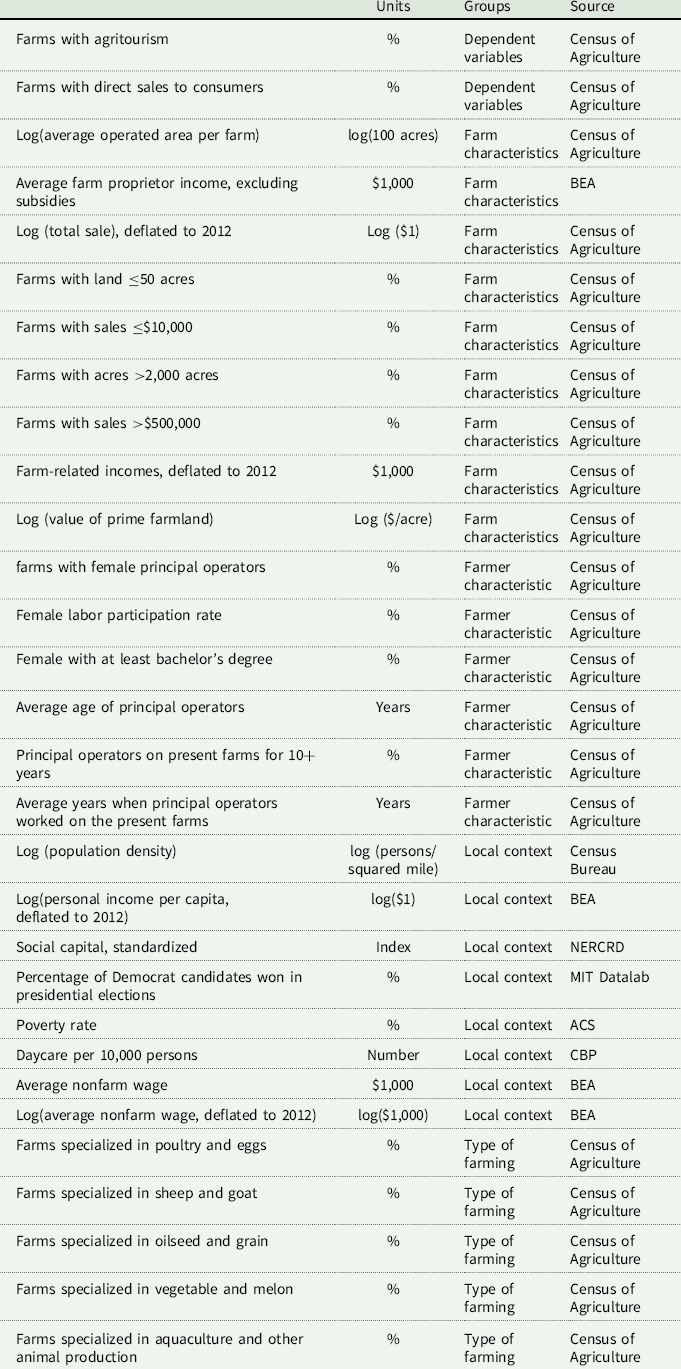
Variables used for the SUR-SDM analysis are listed in Table 4, as noted above, and are drawn from earlier studies identified in the literature review (Van Sandt et al. Reference Van Sandt, Low and Thilmany2018; Schmidt et al. Reference Schmidt, Goetz and Tian2021). In the panel data regression model, we use the regressors lagged five years from the dependent variables to alleviate endogeneity concerns. First, we calculate the two dependent variables, shares of farms with agritourism and farms with direct sales to consumers, from the 2007 to 2017 Census of Agriculture. Next, we calculate the regressors for the four categories: (a) variables that represent farm characteristics, (b) variables that represent farmers’ characteristics, (c) variables that represent farm production type, all of which are from the 2002 to 2012 Census of Agriculture, and (d) the socioeconomic conditions of the local county, such as population size, social capital, political leanings of voters, and the poverty rate as well as average wages, which are obtained from the American Community Survey, Regional Economic Accounts of the Bureau of Economic Analysis, and other data sources, such as the election variable from MIT Election Data and Science Lab (2018). Additionally, as Van Sandt et al. (Reference Van Sandt, Low and Thilmany2018) suggest that counties with more agritourism businesses may have high rates of innovation and entrepreneurship and measured this with the rate of patents, we use the social capital variable from the Northeast Regional Center for Rural Development, Pennsylvania State University (Rupasingha et al. Reference Rupasingha, Goetz and Freshwater2006). Marasteanu and Jaenicke (Reference Marasteanu and Jaenicke2016) posited a positive impact of liberal political orientation as those voters may be more interested to learn about different agricultural production practices; we therefore include the percent of Democratic candidates who won in presidential elections.
Table 4. Descriptive statistics
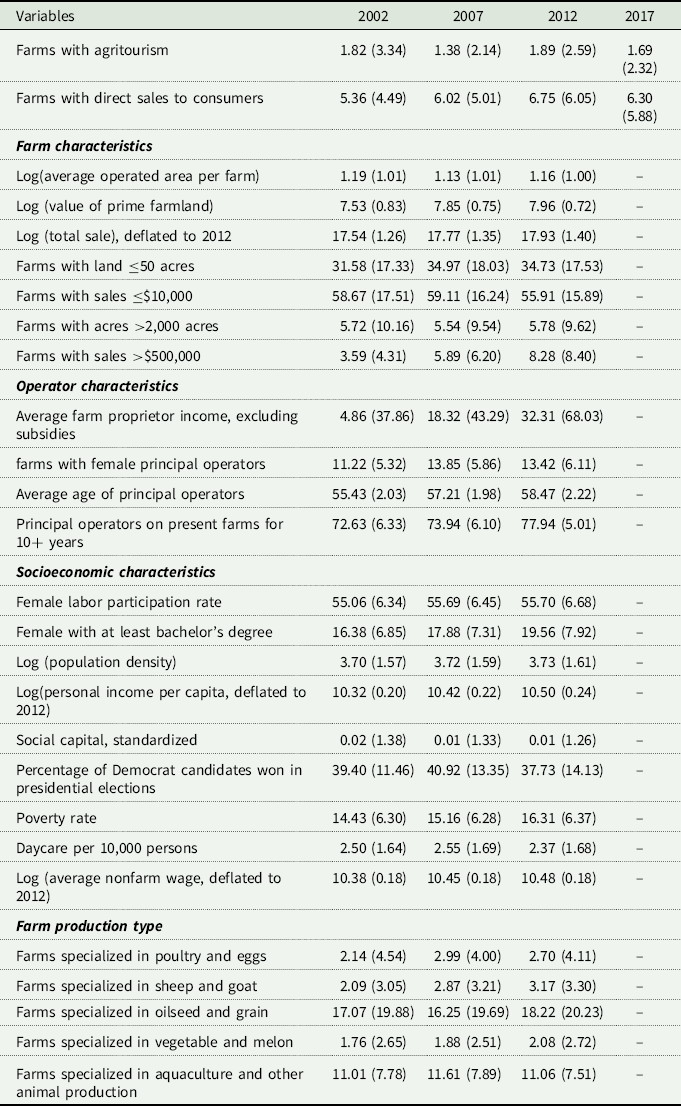
Source: Census of Agriculture, ACS and CBP from U.S. Census Bureau, BEA, MIT Election Lab, NERCRD, and authors’ calculation.
Table 4 shows descriptive statistics for variables in each category and each year. Compared with Marasteanu and Jaenicke (Reference Marasteanu and Jaenicke2016) and Van Sandt et al. (Reference Van Sandt, Low and Thilmany2018) studies, who used single-year data from the 2007 to 2012 Census of Agriculture, we use panel data for all census years, 2002, 2007, 2012, and 2017, in which the county-level variables for agritourism and direct sales are available. These two earlier papers also use GIS data for distance and transportation variables, but such variables are time-invariant, which cannot be used in our fixed effects panel data models.
SUR-SDM regression results
This section describes the model that uses all explanatory variables in Table 4, which yield the smallest Akaike Information Criterion (AIC) even with the largest number of parameters to be estimated. As the SUR-SDM model contains the spatially lagged dependent variables (
 ${\rho _1}{\bi W}AgTou{r_t}$
and
${\rho _1}{\bi W}AgTou{r_t}$
and
 ${\rho _2}{\bi W}DiSal{e_t}$
) at the right-hand side of the equation, according to LeSage and Pace (Reference LeSage and Pace2009), we cannot straightforwardly explain the effect of each explanatory variable from its estimated coefficient. Instead, we need to compute each explanatory variable’s direct, indirect, and total impacts. The direct impact measures the marginal effect of an explanatory variable in a county i on the dependent variable in the same county, the indirect impact measures the effect of the explanatory variable from neighboring counties on the dependent variable in county i, and the total impact is the sum of the direct and indirect impacts that we can think of as the global effect of an explanatory variable. We show the estimated impacts in Table 5 and estimated coefficients in all model specifications in Table S1 in the supplemental materials.
${\rho _2}{\bi W}DiSal{e_t}$
) at the right-hand side of the equation, according to LeSage and Pace (Reference LeSage and Pace2009), we cannot straightforwardly explain the effect of each explanatory variable from its estimated coefficient. Instead, we need to compute each explanatory variable’s direct, indirect, and total impacts. The direct impact measures the marginal effect of an explanatory variable in a county i on the dependent variable in the same county, the indirect impact measures the effect of the explanatory variable from neighboring counties on the dependent variable in county i, and the total impact is the sum of the direct and indirect impacts that we can think of as the global effect of an explanatory variable. We show the estimated impacts in Table 5 and estimated coefficients in all model specifications in Table S1 in the supplemental materials.
Table 5. Impacts in fully specified SDM models
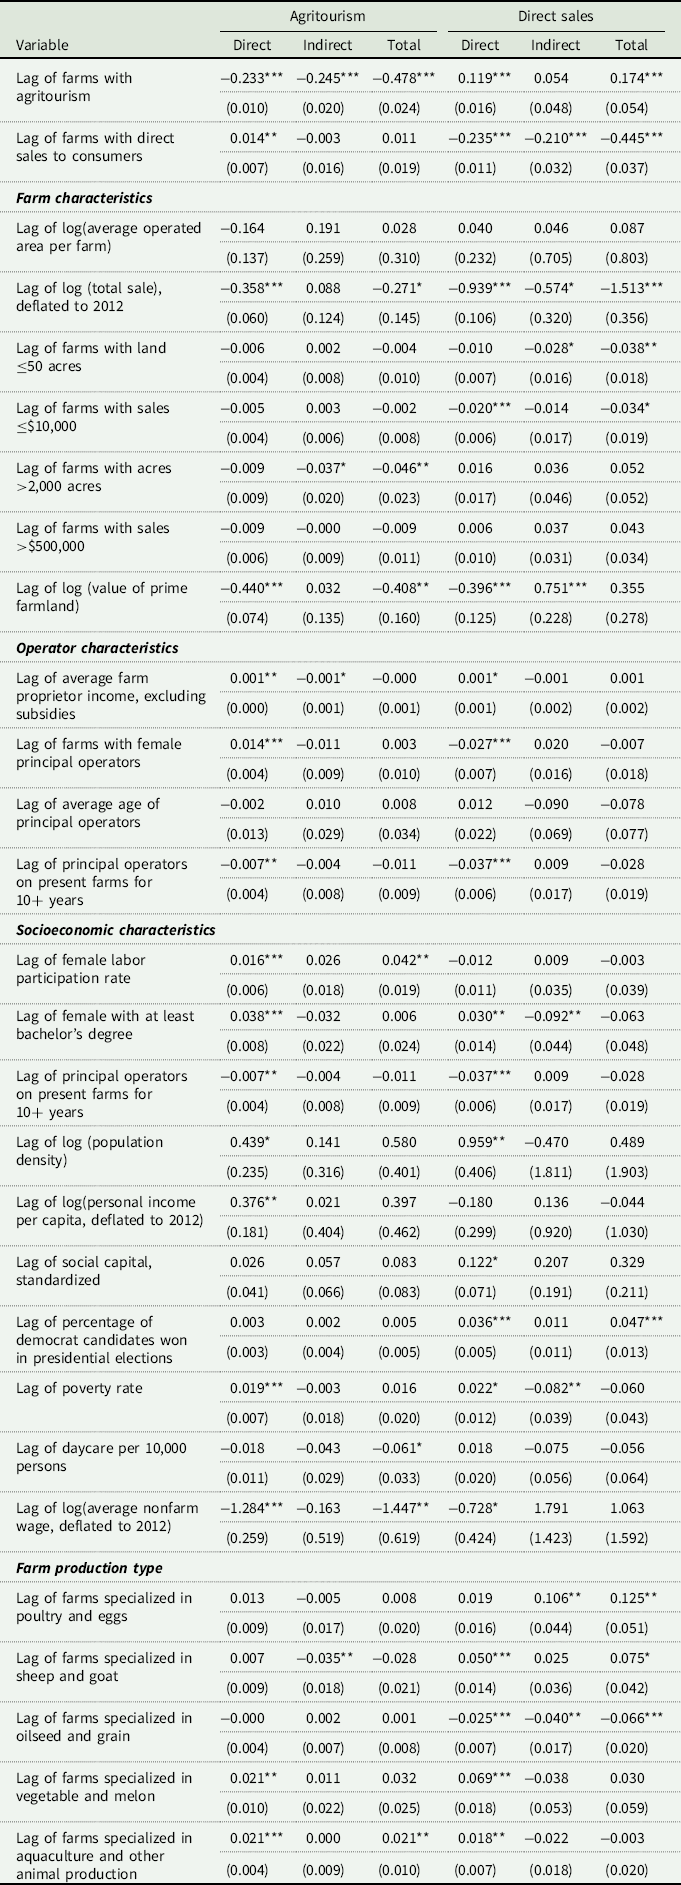
Notes: (1) The spatial autoregressive coefficient for agritourism is 0.343 (0.016) and that for direct sales is 0.288 (0.015). (2) The correlation coefficient for the residuals of the two equations in the SUR-SDM is 0.128. (3) The number of observations is 2892, the log-likelihood is −28,410, and the AIC is 57,058. (4) Significance levels:
*** 1%, **5%, and *1%.
Mutual impacts of agritourism and direct sales to consumers
We confirm the mutual benefits of the two types of farm businesses with the positive and statistically significant direct impact of the 5-year-lagged share of farms with direct sales on agritourism and the positive and significant direct and total impacts of the lagged share of farms with agritourism on direct sales. In other words, the direct effect of a variable means from within the same county; indirect effects are the spillover effects of that variable from adjacent counties. Although the indirect impact of the lagged direct sales on agritourism is negative, it is statistically insignificant. The direct, indirect, and total impacts of the lagged agritourism and direct sales on their own current value are all negative, implying that farms adjust their businesses in the ensuing five years, resulting in a trend reversal.
Variables that represent farm characteristics
While average operated acres of farmland are not a significant factor in either agritourism or direct sales, the prime farmland value negatively affect agritourism, given the significantly negative direct and total impact. But the impact of the prime farmland value on direct sales is ambiguous. A higher prime farmland value in a county reduces the share of farms with direct sales, but higher values in neighboring counties increase the share, resulting in an insignificant total impact. Higher total farm sales also adversely affect agritourism and direct sales, but this does not mean more profitable farms would have less agritourism or direct sales because we also find significant negative direct impacts on direct sales in counties that have a higher share of farms with farm-related sales only less than $10,000, and the impact from counties having more farms with sales greater than $500,000 is not significant. Regarding farm size in acreage, we find both significantly negative indirect impacts from neighboring counties with more small farms that have less than 50 acres and counties with more large farms that have more than 2,000 acres.
Variables that represent farmers’ characteristics
The impacts of average farm proprietor income on agritourism and direct sales are canceled out by the positive direct impacts from a county and the negative indirect impacts from its neighboring counties. A higher share of principal female operators in a county contributes to more farms with agritourism but leads to fewer farms with direct sales. However, the presence of principal female operators in the neighboring counties does not significantly affect agritourism or direct sales. The share of principal operators on the present farm for more than ten years has significantly negative direct impacts on both agritourism and direct sales, but the impacts of farmers’ age are not significant.
Variables that represent farm production type
Positive direct impacts on agritourism come from counties with a higher share of farms specializing in vegetable and melon as well as aquaculture and other animal production. In addition, more farms specializing in sheep and goats in neighboring counties adversely affect agritourism. On the other hand, the share of farms with direct sales in a county is positively affected by the share of farms specialized in sheep and goats, vegetable and melon, aquaculture, and other animal production in the same county and the share of poultry and eggs in neighboring counties. However, direct sales are negatively affected by the share of farms specializing in oilseed and grain in local and neighboring counties.
Variables that represent socioeconomic characteristics
The share of farms with agritourism in a county is positively associated with population density, income per capita, female labor participation rate, the share of females with at least a bachelor’s degree in the same county, and it is negatively associated with the average nonfarm wage and daycare per 10,000 individuals. In addition, the shares of farms with agritourism are adversely affected by the share of females with at least a bachelor’s degree and daycare per 10,000 individuals in neighboring counties. On the other hand, the share of farms with direct sales is positively associated with population density, poverty rate, the share of females with at least a bachelor’s degree, social capital, and the percentage of voters who voted for Democratic presidential candidates. In addition, the shares of farms with direct sales are adversely affected by the poverty rate and the share of females with at least a bachelor’s degree in the neighboring county.
Summary and conclusion
Consumer demand and the need to diversify are driving growth in agricultural operations offering direct sales and agritourism. The exploratory analyses with univariate and bivariate local Moran’s I show that many counties are in either the High-High or Low-Low clusters, implying a positive association between agritourism and direct sales. The SUR-SDM estimation indeed indicates that agritourism and direct sales reinforce each other within the same county, while their mutual spatial spillover effects from neighboring counties are mixed and weak. Agritourism has both stronger direct and total effects on direct sales than is true of the effect of direct sales on agritourism. Therefore, our study, which considers both agritourism and direct sales simultaneously, enriches previous studies that examine only one variable at a time. The somewhat inconsistent findings, at least in terms of spillovers across county borders, are worthy of future research in terms of implications and reasons; it is also worth considering what, if anything, can or should be done about the spillovers. Among the control variables, one notable regressor is the share of female farmers. Previous studies find that the share of women farmers is higher in counties with agritourism (Van Sandt et al. Reference Van Sandt, Low and Thilmany2018; Schmidt et al. Reference Schmidt, Goetz and Tian2021) and that women farmers are generally drawn to sustainable practices and direct sales activities (Inwood Reference Inwood2013; Sachs et al. Reference Sachs, Barbercheck, Braiser, Kiernan and Terman2016). However, these identified interactions have not been investigated previously. We find that a higher share of principal female operators in a county will contribute to more farms with agritourism but lead to fewer farms with direct sales. In addition, principal female operators in the neighboring counties do not significantly affect agritourism or direct sales. This also warrants further research.
More rigorous analyses are needed before providing additional recommendations to policy makers, community leaders, or extension specialists. While not the main focus of this article, our work also has important implications for data collection on agritourism and direct sales. We suggest that these categories should be refined within the Census of Agriculture to better capture growing farm diversification activities, especially now that the popularity of agritourism and direct sales – in large part due to the COVID-19 pandemic – has increased. According to USDA NASS, census data are “the only source of uniform, comprehensive, and impartial agriculture data for every county in the nation.”Footnote 5 By undercounting agritourism and not providing breakdowns of the types of agritourism and direct sales, research is hindered, and private and public resources may not be allocated to their best uses. It also is essential to include agritourism activities that involve direct sales of nonedible products, such as Christmas trees and fiber. More detailed information about the various types of agritourism activities would be valuable for better understanding their determinants and roles in ensuring farm survival. For example, while we know that a significant percentage of beef farms and ranches in Texas offer agritourism, we cannot determine the specific activities. We can only speculate that most revolve around hunting, which is very different from activities in the Northeast, such as farm dinners, events, and tours. Understanding the types of agritourism activities is critical because different agritourism activities need distinct sets of support (Hollas et al. Reference Hollas, Chase, Conner, Dickes, Lamie, Schmidt and Quella2021; Quella et al. Reference Quella, Chase, Conner, Reynolds, Wang and Singh-Knights2021; Schmidt et al. Reference Schmidt, Chase, Barbieri, Rilla, Knights, Thilmany and Leff2022). The more detailed data would help direct resources to where they are needed most, with the potential to significantly improve the effectiveness of research and Extension to support agricultural producers.
Supplementary material
To view supplementary material for this article, please visit https://doi.org/10.1017/age.2023.1
Data availability statement
Data are publically available or by request.
Acknowledgements
This work was supported in part by the United States Department of Agriculture, National Institute of Food and Agriculture (NIFA) under projects # 2020-68006-31683 and #2021-51150-34733 and by the Pennsylvania State University and NIFA Multistate/Regional Research Appropriations under project #NE2249.
Conflicts of interest
Authors Schmidt, Tian, Goetz, Chase, and Hollas declare none.
Table A.1. Variable description and data sources


 Open access